Today was finally paid off with the Simulink model that generated histogram equalized output. I started with the example model (Fig. 1). It appeared after typing ex_vision_find_histogram in command line of MATLAB 2016b.
Fig. 1
Conversion to gray scale version was really time-consuming. After a couple of mistakes and few hours, I decided to do it as in Fig. 2.
Fig. 2
The real challenge was to set 'Sample time' to 0.2 for 'Image From File' block. This information was not found in initial example in Fig. 1. Reading a couple of articles after Google search on error message was quite helpful to do error-and-trial that really worked. The input color image and gray scale image are in Fig. 3 and Fig. 4, respectively.
Fig. 3
Fig. 4
Histograms are shown in Fig. 5 and equalized image in Fig. 6.
Fig. 5 Need to right click inside scope and select 'Autoscale'.
Fig. 6
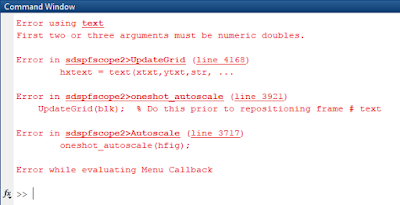
Do not forget errors that appeared in MATLAB command window, see Fig. 7.
Fig. 7
Finally, the error which took most of time. It really deserve a treat -- regenerated in Fig. 8 to share learning of the day! How to fix? See Fig. 9.
Fig. 8
Fig. 9
How I figured it out? Really! Fig. 10 explains it.
Fig. 10


No comments:
Post a Comment